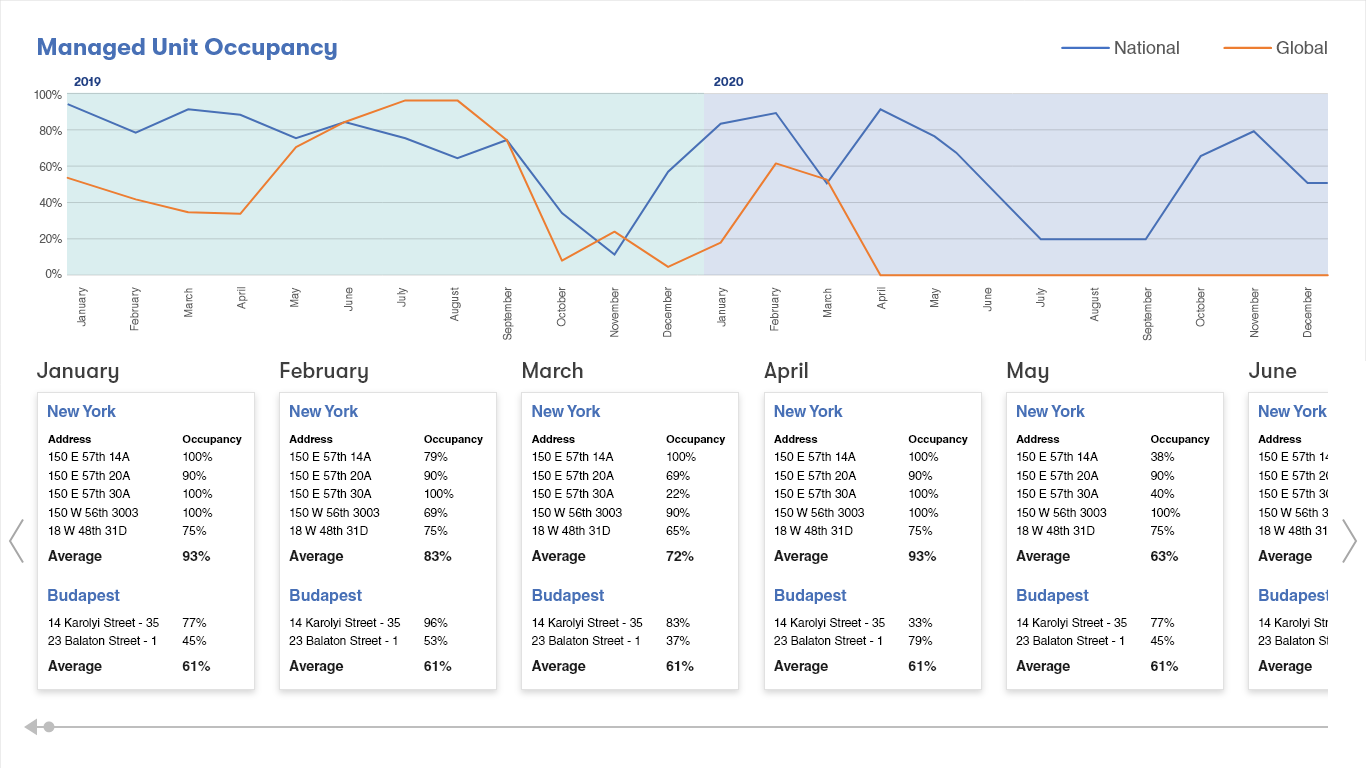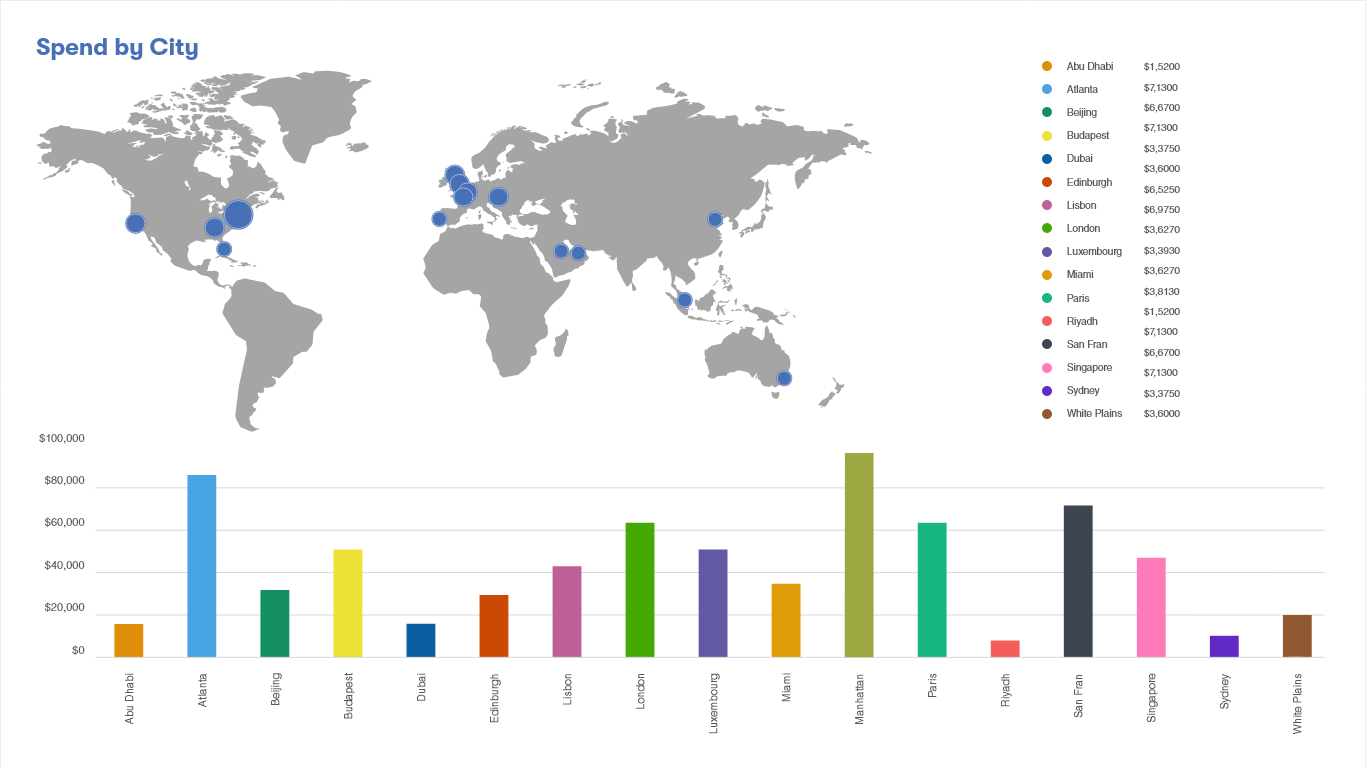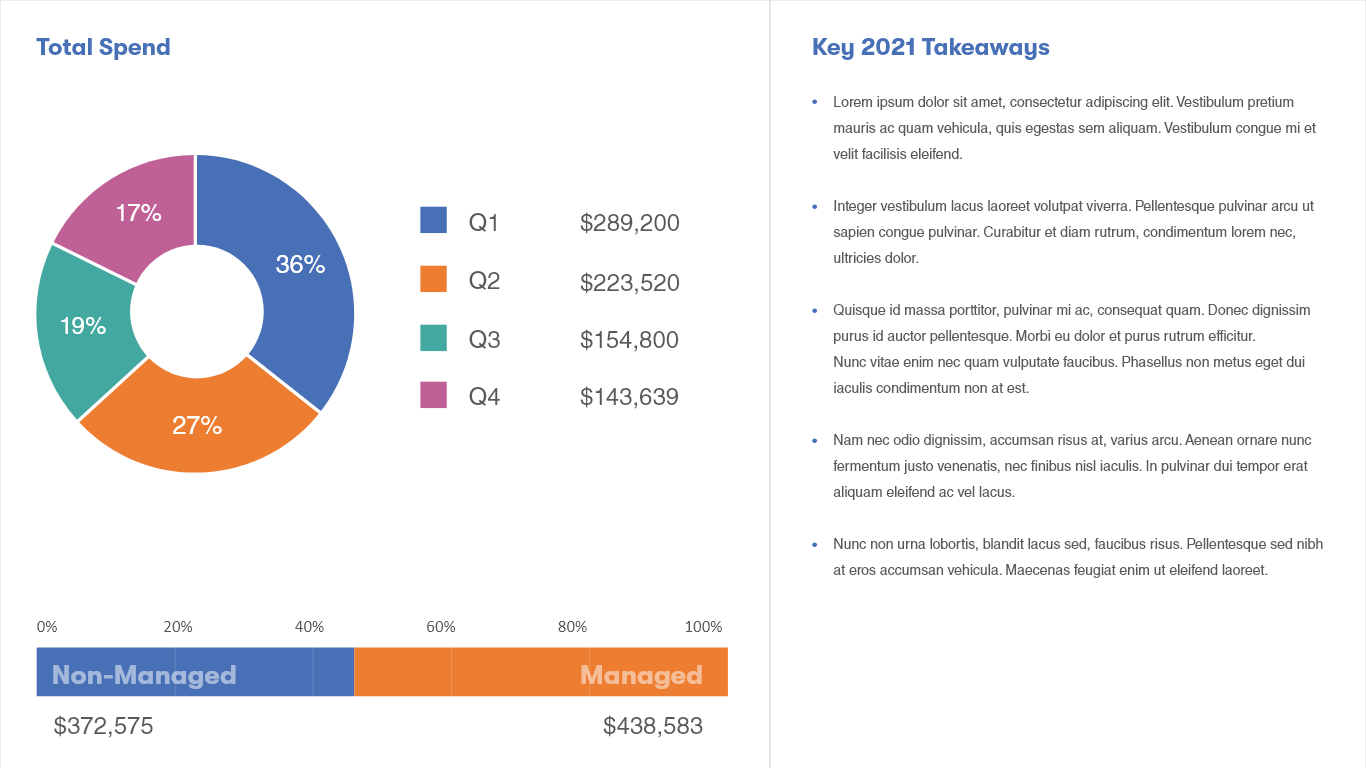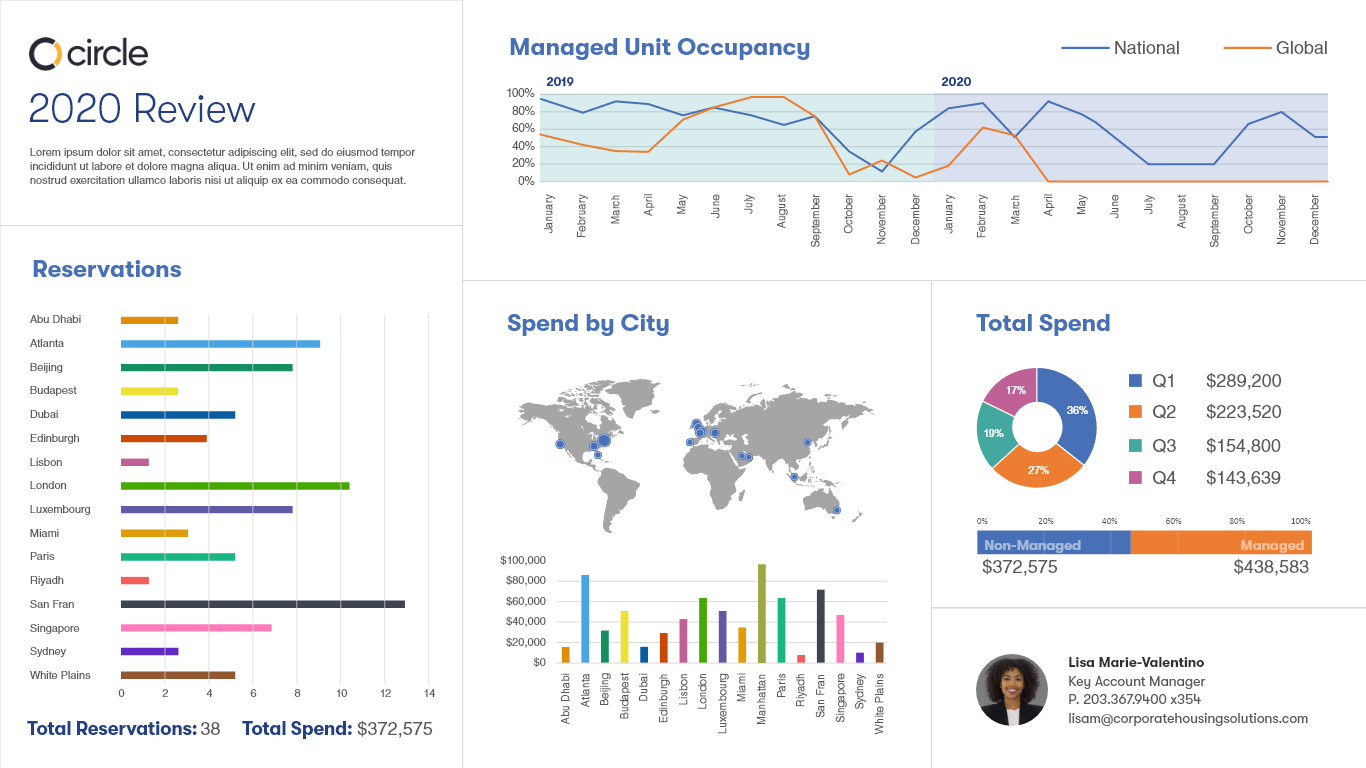
Project Goal: Top Furnished Quarters clients receive an annual review of employee reservation statistics. This was once provided as handful of spreadsheets. I decided to replace that with a cleaner solution. I wanted all high-level data visualized on a single screen, and I wanted it available in a web browser rather than bulky PDF delivered by email.
I achieved this goal with an unorthodox combination of tools. I used Excel to generate vector pivot charts, and exported them to Adobe XD. This allowed me to add the interactivity required to keep everything on one screen. This workflow allowed me to create future reports simply by updating the spreadsheet data and publishing a new link for the client.